Consider this scenario: You flip through your usual stack of mail and notice a home energy report provided by your energy company. As you open it, you expect to see charts and graphs that outline your typical usage (which you do) – but to your surprise, you also see two smiley faces accompanied by the word “GREAT.” They are telling you that your monthly energy usage is 15 percent lower than even your energy-efficient neighbors, resulting in a lower monthly bill.
How does this make you feel? Does it impact the choices you make in your energy consumption moving forward?
Peer pressure – in a good way
This scenario is from a study conducted by OPOWER between 2009 and 2011. [1. opower.com/uploads/library/file/1/allcott_2011_jpubec_-_social_norms_and_energy_conservation.pdf] The company studied the effect of its engagement programs related to energy usage in an effort to demonstrate that OPOWER’s targeted and social-comparison programs had a favorable impact on lowering the overall and individual utilization of energy. OPOWER partnered with utilities on the West Coast, in the Midwest, in the urban Northeast, and in one suburban area in a Mountain state to deliver home energy reports that highlighted an energy user’s monthly electrical utilization as compared to that of his “Efficient Neighbors” and of “All Neighbors.” The report characterized each customer’s efficiency standing as “Below Average,” “Good,” or “Great” – and highlighted high ranking with one or two smiley faces as illustrated in the example.

Based on data from >600,000 treatment and control households throughout the country, the study estimated that a typical OPOWER program focused on changing behavior to lower energy usage resulted in an energy-consumption reduction of 2 percent. This decrease was considered comparable to a price increase of between 11-20 percent!
This approach falls somewhere between a carrot and a stick by applying peer pressure without the associated peer actually realizing it. It gives individuals clear information on how they rank relative to their neighbors so they can more easily evaluate their usage and make changes based on this information.
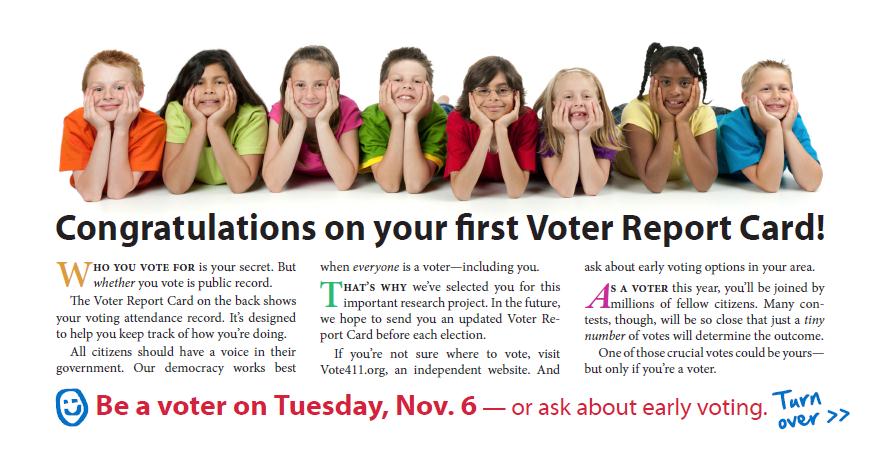
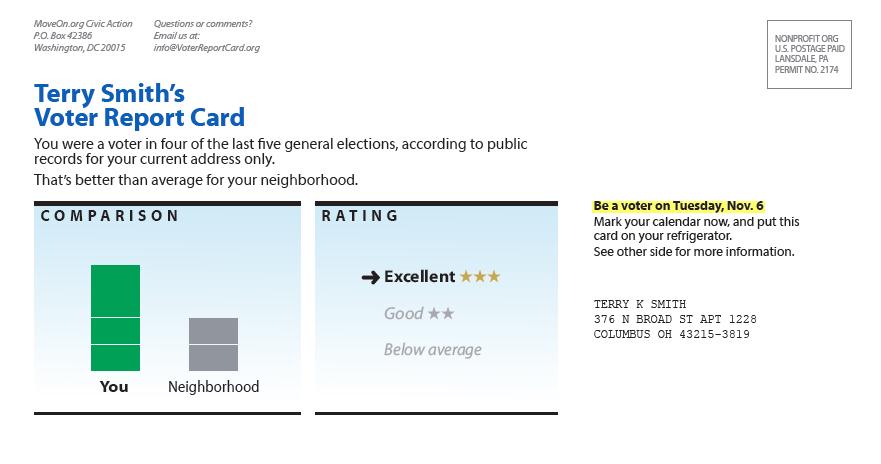
This type of feedback loop has also been recently applied in politics by MoveOn.org. Specifically, just prior to the recent presidential election, MoveOn targeted 12 million registered users in battleground states who didn’t cast a ballot in the last presidential election with “voter report cards,” which based a voter’s (or non-voter’s) grade on how often she voted in the past – and compared her voting record to that of her neighbors. See example:


Regardless of your political leanings, these types of approaches to compare your behavior to the behavior of your friends, family, peers, or even nearby acquaintances seems to resonate and is becoming a common approach to encouraging behavior change.
Feedback loops and population health management
While these examples may not seem directly applicable to health management, the concept of providing individuals continuous feedback is. As we move into a new era of healthcare consumerism, it is becoming more and more important for individuals to have the information they need to make informed decisions about their healthcare – and to encourage them to use that information to make good choices. Whether comparing hospitals to better understand quality levels related to particular conditions or procedures, or comparing providers on total cost, informed consumers will drive better decisions and help manage healthcare costs.
Feedback loops are also a critical component of driving employee behavior change around health and wellness. For example, WebMD uses feedback loops in our health risk assessment that helps people understand how their health status compares to peers in their company.
Have you applied feedback loops to your health management program?
- Can employees easily compare cost and quality information when determining which benefit plan is right for them? Is the process interactive, giving them immediate feedback to what-if scenarios and different options?
- Are employees encouraged to “know their numbers” and get a biometric screening? Do you provide feedback in the form of annual reports on overall population risk reductions or personal case studies in employee newsletters?
- Do you encourage company-wide wellness challenges that give employees fun, friendly competitions (with rankings and prizes) to improve healthy exercise or eating patterns?
- Do you provide an online health risk assessment that helps employees understand their current health risks, and where they rank in comparison to their peers?
Feedback loops are one element of “gamification” – a popular new approach to engage with audiences. You can learn more in our white paper or archived webinar.

